Where to Store Your Application Logs on Azure
Logging is one of those things every developer does, but few think about deliberately. Where your logs go matters — it affects how fast you can debug, how long you can retain history, and how much you pay. Azure gives you several options, and they're not interchangeable. Here's a breakdown of each and when it makes sense to use it.
1. Azure Monitor
Tip: To find this in the Azure portal, search for "monitor" — not "azure monitor". Typing the full name often returns no results.
Before diving into specific services, it helps to understand the big picture. Azure Monitor is the umbrella product that covers all observability on Azure. It doesn't store logs itself — it's the platform that connects everything together: dashboards, alerts, metrics, and the services below.
Both Log Analytics Workspace and Application Insights are products that live under Azure Monitor. They can each be used independently, but in practice they feed into Azure Monitor — it's where you build dashboards, set up alerts, and view everything in one place.
What you can do with Azure Monitor:
- •Create metric alerts (CPU over 80% for 5 minutes → send a notification)
- •Create log alerts (more than 10 errors in 5 minutes → trigger an action)
- •Build workbooks (interactive dashboards backed by KQL queries)
- •View Log Analytics and Application Insights data side by side
Think of it as the control plane. Log Analytics and Application Insights are where the data lives — Azure Monitor is how you act on it.
2. Log Analytics Workspace
This is the backbone of logging on Azure. A Log Analytics Workspace is a centralized store where logs from almost any Azure service can land — and where you query them using Kusto Query Language (KQL).
But here's the part most guides skip: creating the workspace alone is not enough. The workspace is just the destination — an empty database waiting for data. You still need to tell Azure what to collect and where to send it. That's where Data Collection Rules come in.
Important: Your Log Analytics Workspace must be in the same region as the resource you want to monitor. If your VM is in East US and your workspace is in West Europe, the resource won't appear as an available option when setting up collection. Always create the workspace in the same region as your resources.
Step 1 — Create the workspace
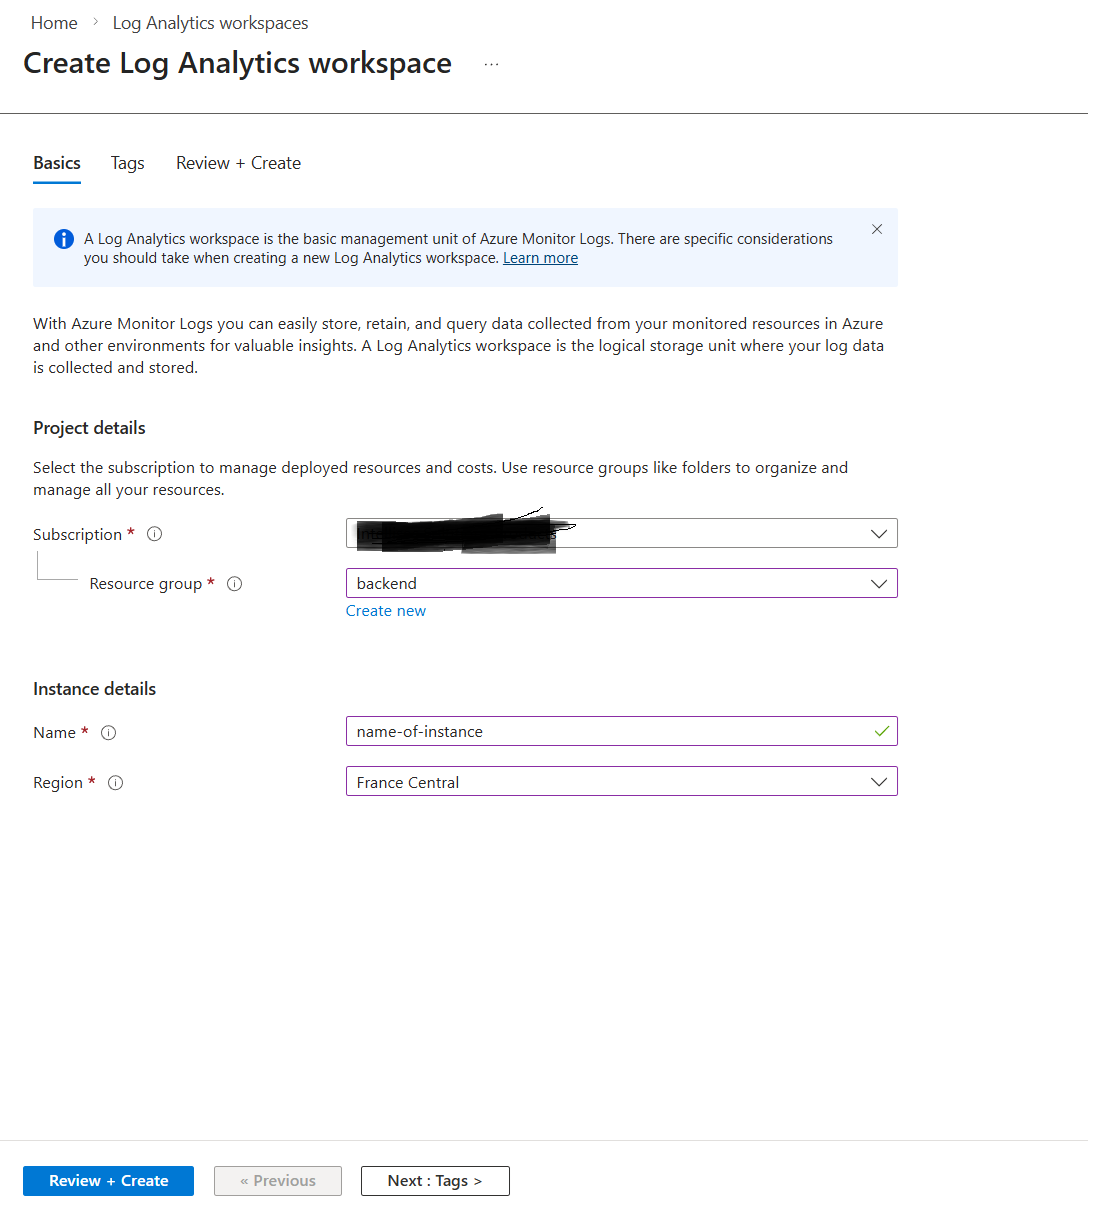
Create the workspace and take note of the region you select. Everything else will need to match it.
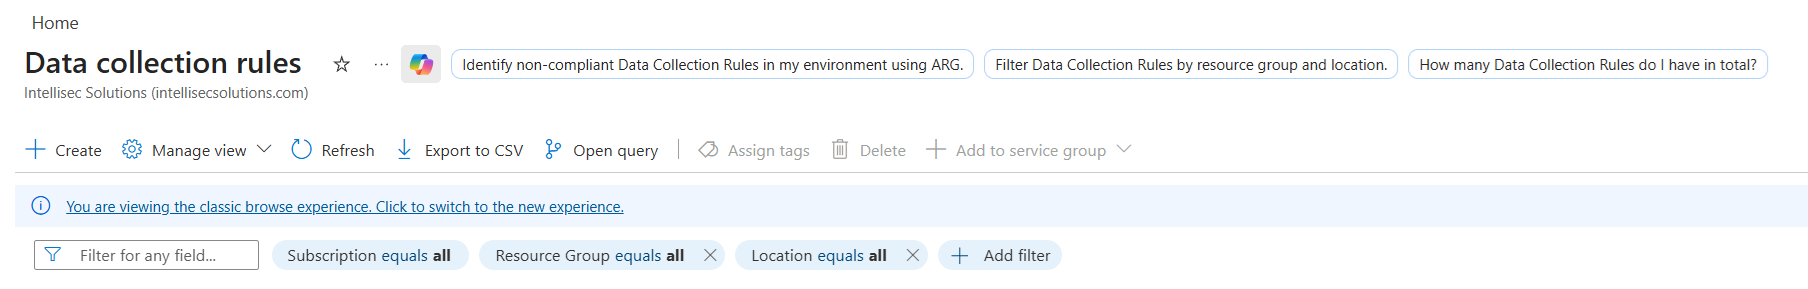
Step 2 — Create a Data Collection Rule
Say you create a Log Analytics Workspace called my-logs-workspace. Nothing flows into it yet. To get your VM's logs in there, you need to create a Data Collection Rule (DCR).
Think of it this way:
- •The Log Analytics Workspace is the warehouse — it stores everything.
- •The Data Collection Rule is the instruction manual — it defines what to collect (Windows Event logs, Linux Syslog, performance counters) and which workspace to send it to.
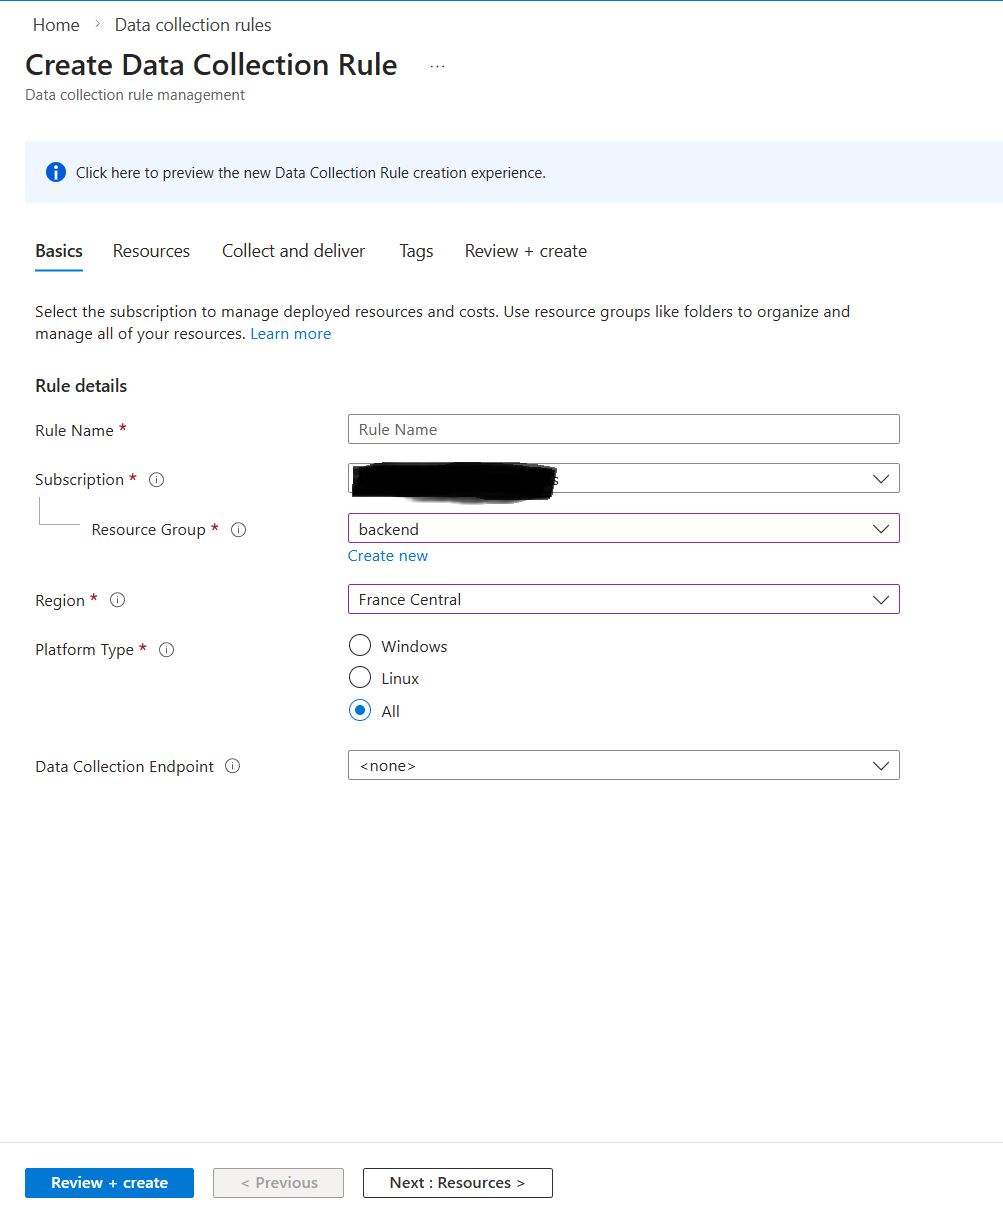
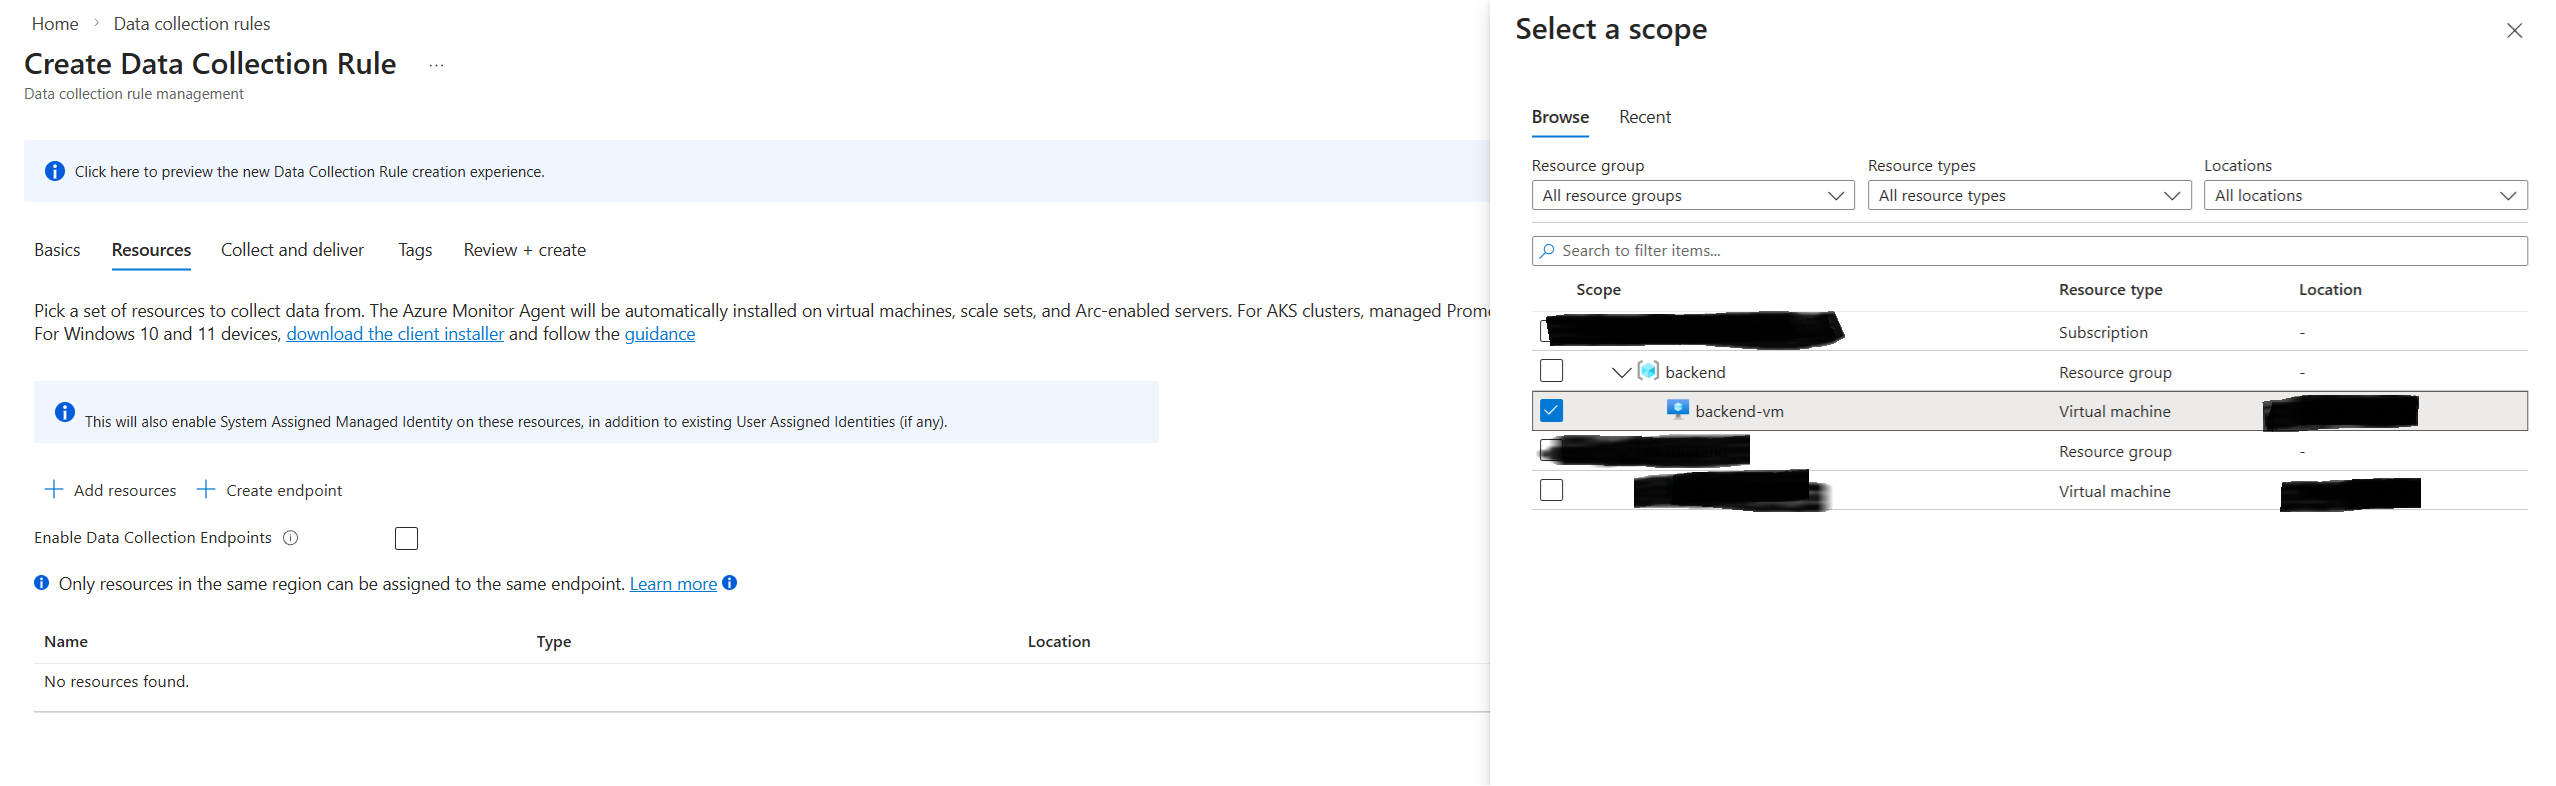
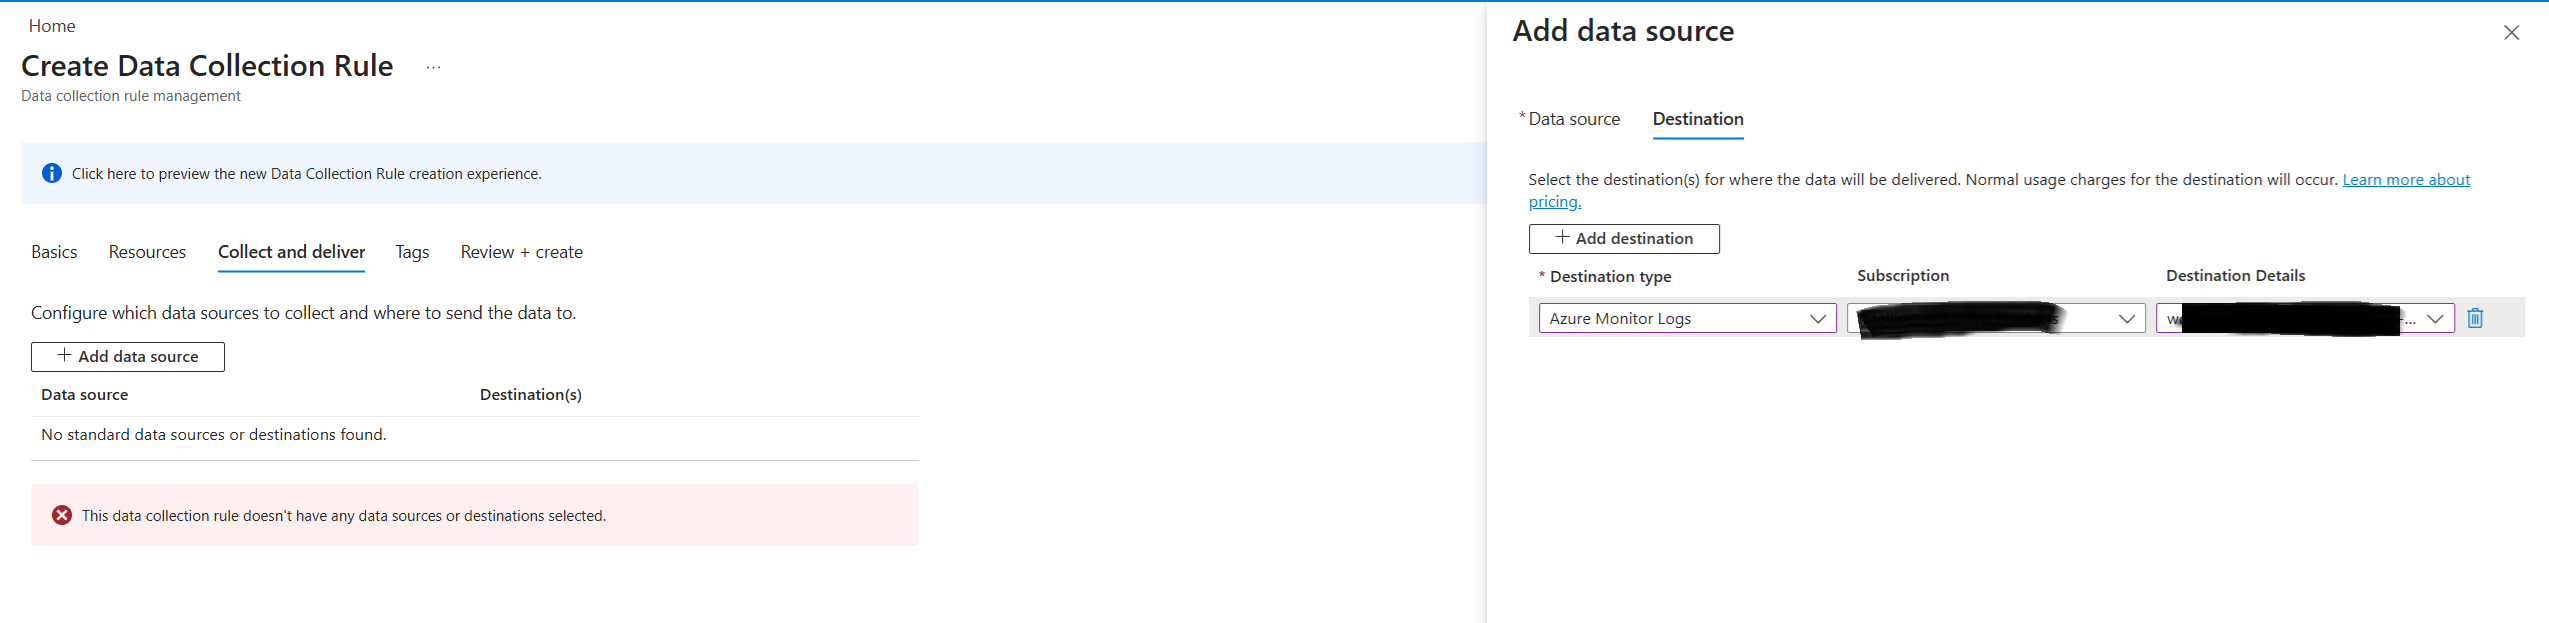
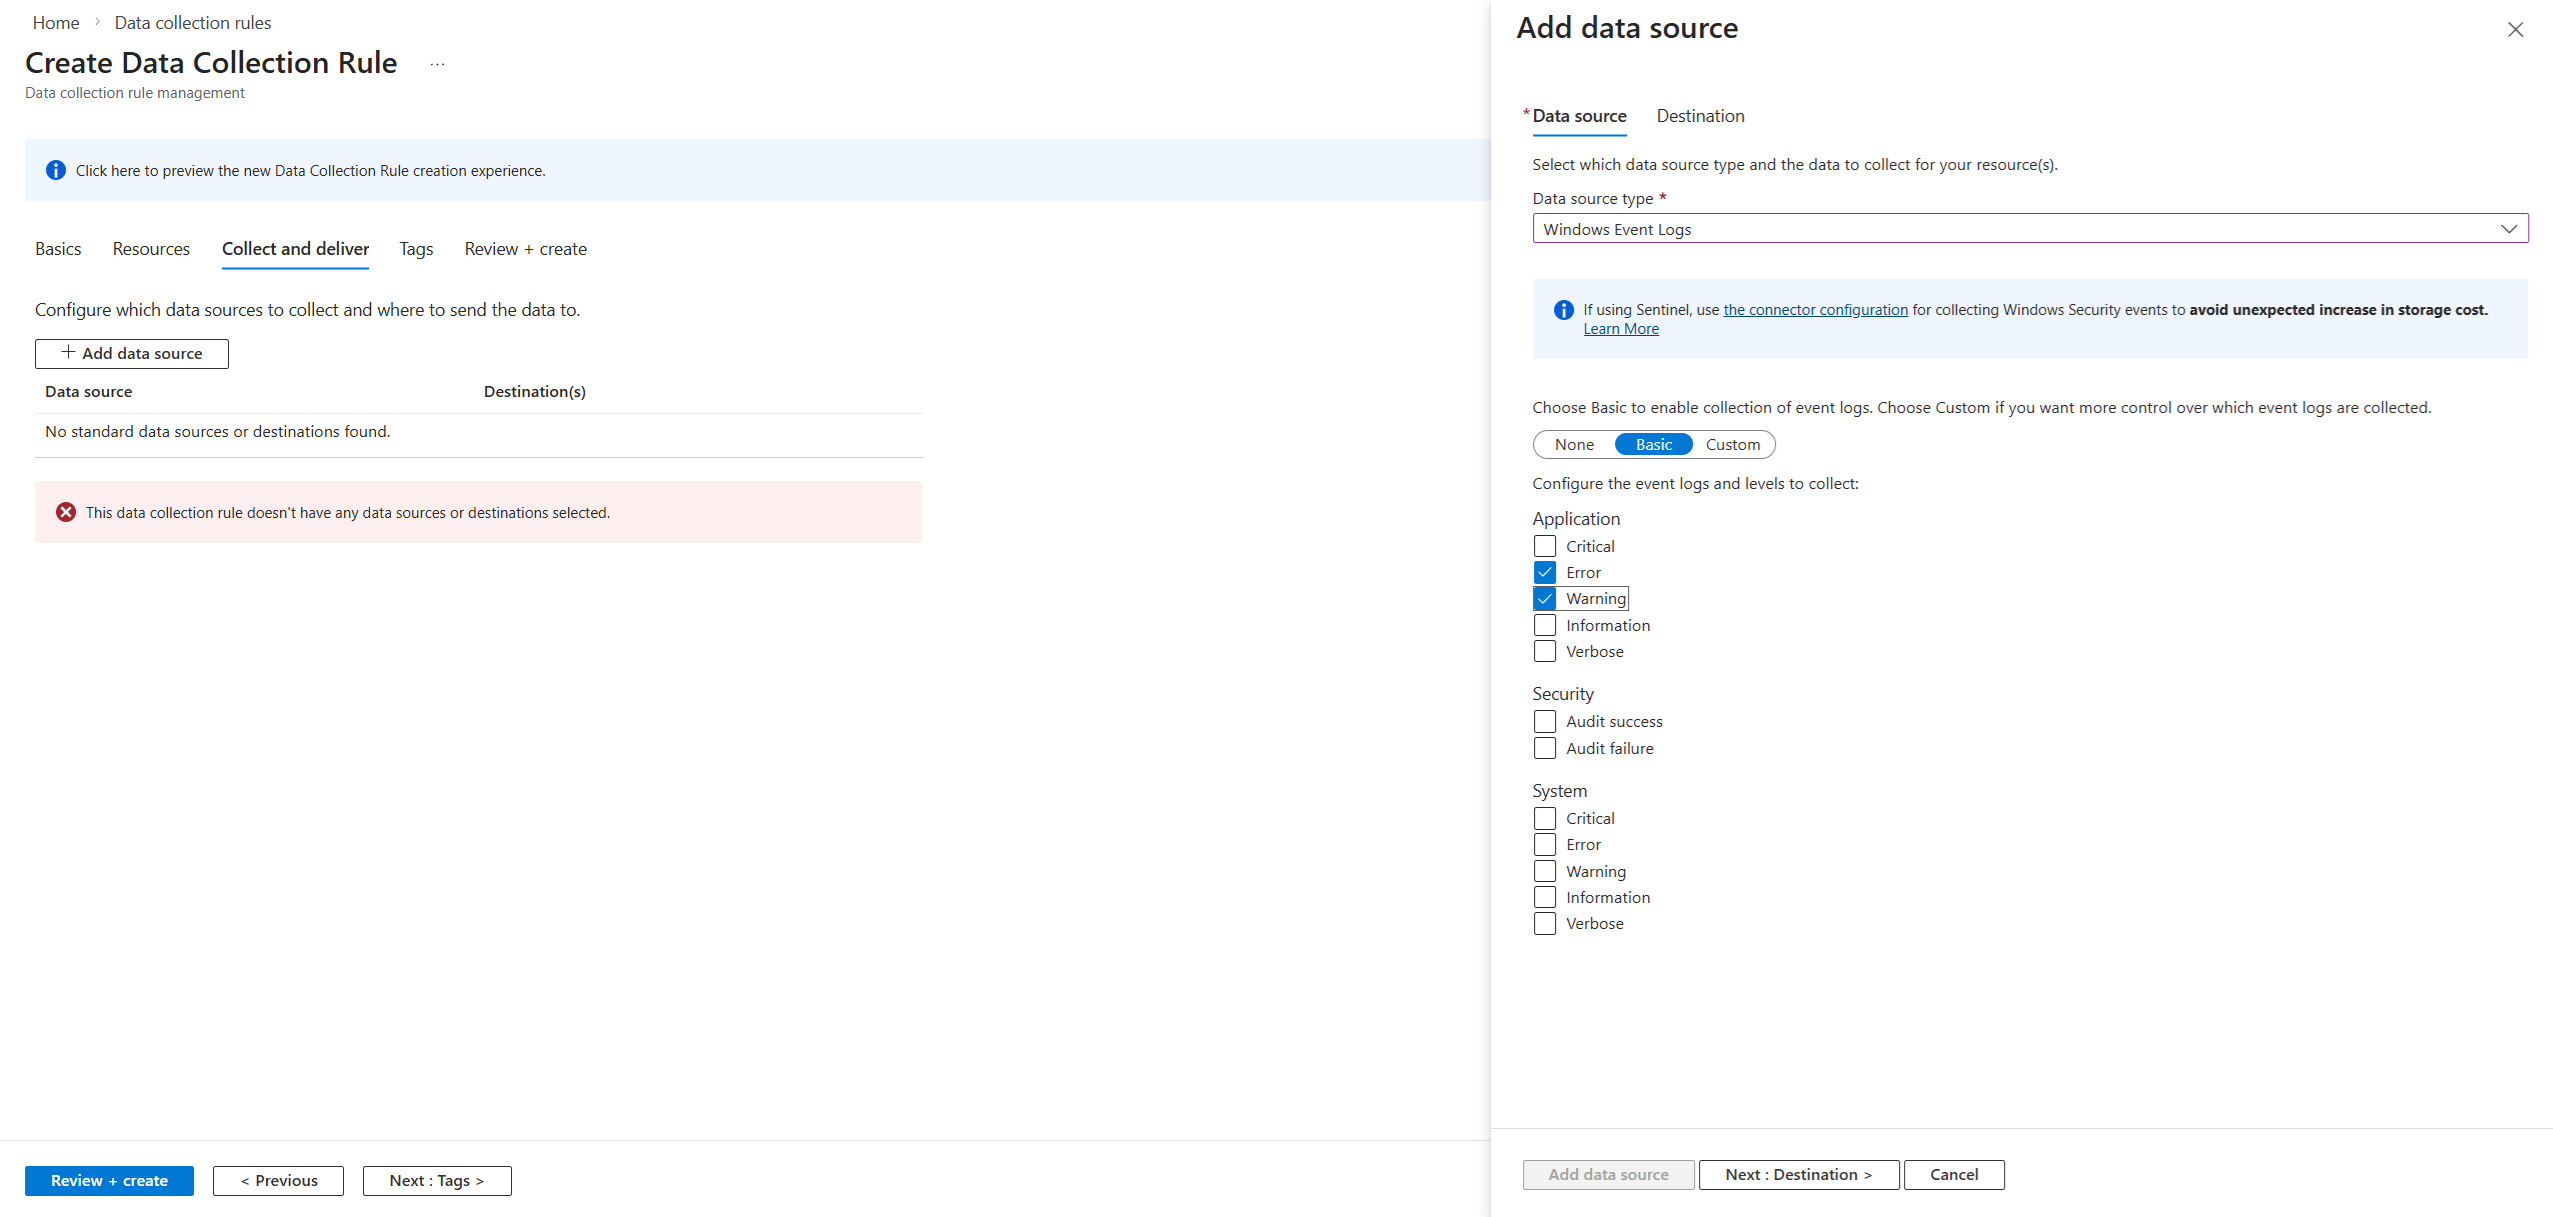
When creating a DCR, you:
- •Select the VM (or VMs) you want to monitor as the data source
- •Choose what to collect — Syslog for Linux, Windows Event Logs for Windows, or both
- •Select the destination — your Log Analytics Workspace
Step 3 — What happens behind the scenes
The moment you hit Review + Create on the DCR, Azure automatically does two things:
- •Installs the Azure Monitor Agent (AMA) on your VM
- •Pushes the DCR (the "instruction manual") to that agent
You don't touch the VM. Azure handles the agent installation and configuration for you.
How to verify it worked
Once the DCR is created, wait about 5 minutes, then go to your Log Analytics Workspace and click Logs. Run one of these queries depending on your VM type:
Linux VM:
Syslog
| take 50
Windows VM:
Event
| take 50
If you see rows of data with your VM's name in the results, it's working.
Good for:
- •Centralizing logs from multiple services in one place
- •Writing KQL queries to filter, aggregate, and correlate logs
- •Powering Azure Monitor dashboards and alerts
- •Long-term log retention (configurable up to 12 years with archive tiers)
Example KQL query:
ContainerAppConsoleLogs
| where TimeGenerated > ago(1h)
| where Log contains "ERROR"
| project TimeGenerated, ContainerName, Log
| order by TimeGenerated desc
Almost everything else on this list feeds into a Log Analytics Workspace eventually. Think of it as the query layer.
3. Application Insights (also under Azure Monitor)
Application Insights is built specifically for application-level telemetry. You connect your app to it via the SDK (available for .NET, Node.js, Python, Java, and more), and it automatically sends that data to a Log Analytics Workspace behind the scenes — meaning your app telemetry lands in the same place as your infrastructure logs, queryable with KQL alongside everything else. It automatically captures:
- •Request rates, response times, and failure rates
- •Exceptions and stack traces
- •Custom events and traces you emit from code
- •Dependency calls (outbound HTTP, database queries)
- •User sessions and page views (for web apps)
Application Insights gives you a purpose-built UI for navigating that data — the Application Map, Live Metrics stream, and end-to-end transaction traces.
Good for:
- •Application performance monitoring (APM)
- •Distributed tracing across microservices
- •Catching exceptions and slow dependencies in production
- •Correlating a user-facing error to its root cause in code
4. Azure Storage (Blob / Table)
This is not the modern way to handle logs — most teams today use Log Analytics for monitoring and querying. Azure Storage is a niche destination used when you need to dump raw logs cheaply for compliance or archival, not for actively working with them. Think of it as a cold storage option: logs go in, and you only touch them if an audit or investigation forces you to.
For long-term archival or high-volume scenarios where you don't need to query logs in real time, Azure Storage is the cheapest destination.
- •Blob Storage — logs are written as flat files (JSON or text). Cheap, durable, and good for compliance archival. Not queryable without loading files into another tool.
- •Table Storage — structured key-value store. Slightly more queryable than blobs, but still not a real log analytics tool.
Azure services that support diagnostic settings let you route logs to a storage account directly alongside (or instead of) a Log Analytics Workspace.
Good for:
- •Long-term archival at low cost
- •Compliance scenarios that require raw log retention
- •Exporting logs to process with external tools
Watch out for: There's no built-in query interface. To analyze logs in Blob Storage you need to load them into Log Analytics or process them with something like Azure Data Factory or Spark.
5. Azure Event Hubs
The simplest way to understand Azure Event Hubs is that it is not a destination — it is a transportation pipe.
Event Hubs is a high-throughput message streaming service — essentially a managed Kafka. For logging, it acts as a pipeline rather than a destination: logs flow through Event Hubs and land somewhere else (a third-party SIEM, Blob Storage, or a custom processor).
Why do you need it?
You need Event Hubs when Log Analytics is not the final stop for your data. In your architecture, you usually have three choices for where a log goes — and you pick Event Hubs for one specific reason: external integration.
| Destination | Why you choose it |
|---|---|
| Log Analytics | You want to query the data inside the Azure Portal |
| Storage Account | You want to save the data for years because of compliance or legal requirements |
| Event Hubs | You want to send that data to a non-Azure tool (Splunk, Datadog, a custom script) |
Flow:
Azure Service → Diagnostic Settings → Event Hubs → Splunk / Datadog / Custom Consumer
Most diagnostic settings on Azure services offer Event Hubs as an output alongside Log Analytics and Storage. You can use all three at the same time.
How to Choose
| Scenario | Recommended service |
|---|---|
| Central log store for Azure services | Log Analytics Workspace |
| Dashboards and alerting | Azure Monitor |
| Application performance and tracing | Application Insights |
| Long-term archival at low cost | Azure Blob Storage |
| Streaming to a third-party SIEM | Azure Event Hubs |
In practice, most Azure workloads use a combination: Application Insights for app telemetry, Log Analytics for infrastructure and platform logs, Azure Monitor for alerts and dashboards, and Blob Storage for long-term archival. Start with Log Analytics and Application Insights — they cover the majority of use cases — and add the others only when you have a specific reason.
Aziz Jarrar
Full Stack Engineer